[* Two updates appended at the bottom]
It started off as a wasteful exercise by Sharath, where he tracked birthdays for two weeks on Orkut just to see if he knew at least one person born on each day of the year. Something I noticed from his sampling though, was that he had about 2 birthdays / day in his stats … which means he should have roughly 365×2 = 730 friends on his Orkut list. Well, guess what, he has 736 friends on his list! Which suggested that birthdays are sort of evenly distributed across the year.
However, in my personal observation, I’ve seen more people born in the latter half of the year, than the first half. There always seemed to be a ton of birthdays around Oct/Nov rather than, say, April/May. He then went on to make a distribution of birthdays from his class of ’97 – and found that there were 28 birthdays in the first half as opposed to 36 in the second – a small victory for my observation. I couldn’t wait to try this on more stats, so I sampled my own class of ’98 – fairly simple, as we have a database on our yahoo group, and these were the results:
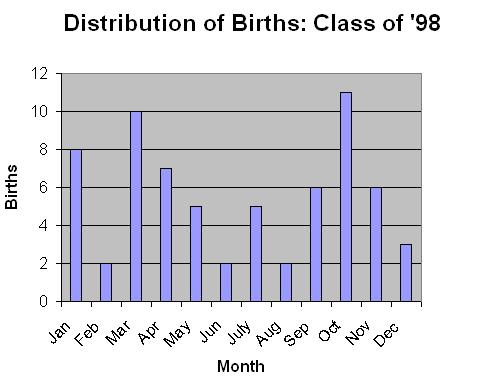
The stats for my class are: 34 born in the first half, and 33 born in the second half – an almost even distribution. Well, so much for my lead :( . But I found an interesting article on the monthly distribution of births in rural India – and guess what ? There is a very clear bias for births in the second half. Which means – high rates of conception in December/January. The paper also refers to a similar increase in conception rates in the United States, attributed to the Christmas (Holiday?) season :) .
So what are the factors you think contribute to an uneven distribution ? Off the top of my head – I’d say
- Astrological ‘luck’ periods – especially for couples in India
- Admission to Kindergarten – I’d assume that more people would like their kids to *just make* the eligibility criteria. For instance, if the cut-off for admission to Kindergarten is ‘Those born in 95’, I’d think that people would think it is an advantage to be born in the latter half of ’95, say Nov-Dec, as they are almost a year younger than those born in Jan, yet they are on the same ‘level’ academically.
- When you get married also influences birth – at least it used to :) .
What are the other reasons you think there are for an uneven distribution of births across a year? Have you noticed a trend amongst your friends?
On another note, I can probably explain why I *feel* more of my friends are born in the latter half of the year – It is simply because I’m born in October and it is more easy for me to remember those that were born in Sep/Oct/Nov than in the earlier half of the year :). I’m not sure what bias to call it. Maybe you can help me with that too.
Update 1: A regular visitor and commentator at this site, Luciferratic gives us some data from a much larger dataset. The chart is astonishing. There is either something wrong with the dataset, or May is the most romantic time of year in the Middle-East ! :)
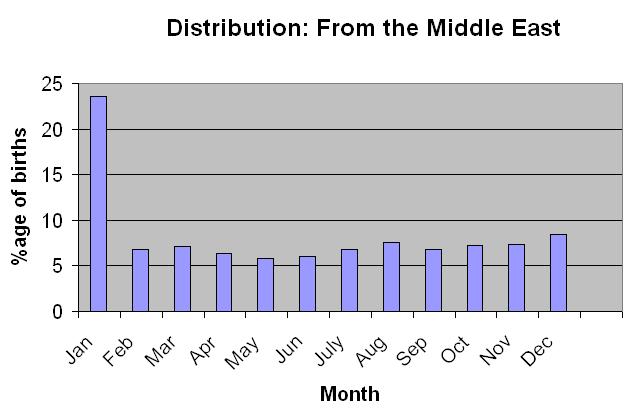
Update 2: Our instincts are right … there is a reason there are that many January-borns in the data set … Wanna brainstorm on this for a while ? So what you know as of now is : The dataset is huge, it has data of people of all ages, and they are mostly middle-eastern. Now: What possible reason can you think of for this spike in the dataset for January?
Spend some time on this… the solution is elusive but I’m sure someone should be able to figure this out!
.
.
.
.
Luciferratic answers this question (along with a bunch of unnecessary apologies!) in his comment here.
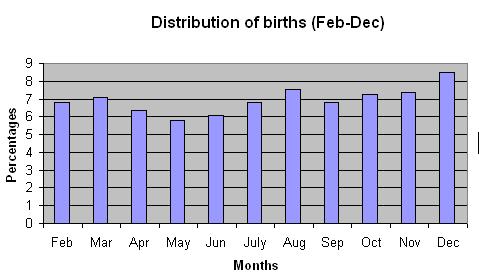
Taking January out of the graph, as we know it is likely to have skewed data, the graph is quite even, as follows. There still seems to a bias towards the latter half though (Note: I have not corrected the percentage values in the graph, merely removed the January bar):